Zebra Metrics
Zebra has support for Prometheus, configured using the prometheus compile-time feature,
and the MetricsSection runtime configuration.
The following steps can be used to send real time Zebra metrics data into a grafana front end that you can visualize:
-
Build zebra with
prometheusfeature:cargo install --features prometheus --locked --git https://github.com/ZcashFoundation/zebra zebrad -
Create a
zebrad.tomlfile that we can edit:zebrad generate -o zebrad.toml -
Add
endpoint_addrto themetricssection:[metrics] endpoint_addr = "127.0.0.1:9999" -
Run Zebra, and specify the path to the
zebrad.tomlfile, for example:zebrad -c zebrad.toml start -
Install and run Prometheus and Grafana via Docker:
# create a storage volume for grafana (once)
sudo docker volume create grafana-storage
# create a storage volume for prometheus (once)
sudo docker volume create prometheus-storage

# run prometheus with the included config
sudo docker run --detach --network host --volume prometheus-storage:/prometheus --volume /path/to/zebra/prometheus.yaml:/etc/prometheus/prometheus.yml  prom/prometheus

# run grafana
sudo docker run --detach --network host --env GF_SERVER_HTTP_PORT=3030 --env GF_SERVER_HTTP_ADDR=localhost --volume grafana-storage:/var/lib/grafana grafana/grafana
Now the grafana dashboard is available at http://localhost:3030 ; the default username and password is
admin/admin. Prometheus scrapes Zebra onlocalhost:9999, and provides the results onlocalhost:9090. -
Configure Grafana with a Prometheus HTTP Data Source, using Zebra’s
metrics.endpoint_addr.In the grafana dashboard:
- Create a new Prometheus Data Source
Prometheus-Zebra - Enter the HTTP URL:
127.0.0.1:9090 - Save the configuration
- Create a new Prometheus Data Source
-
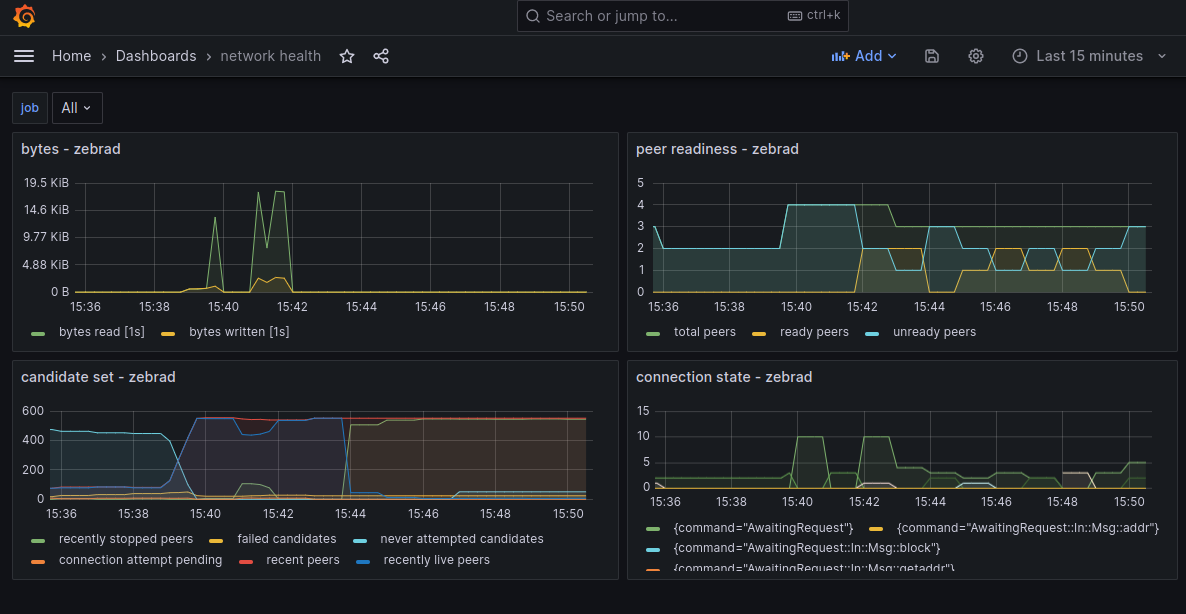
Now you can add the grafana dashboards from
zebra/docker/observability/grafana/dashboards/(Create > Import > Upload JSON File), or create your own.